Regions and Data rules
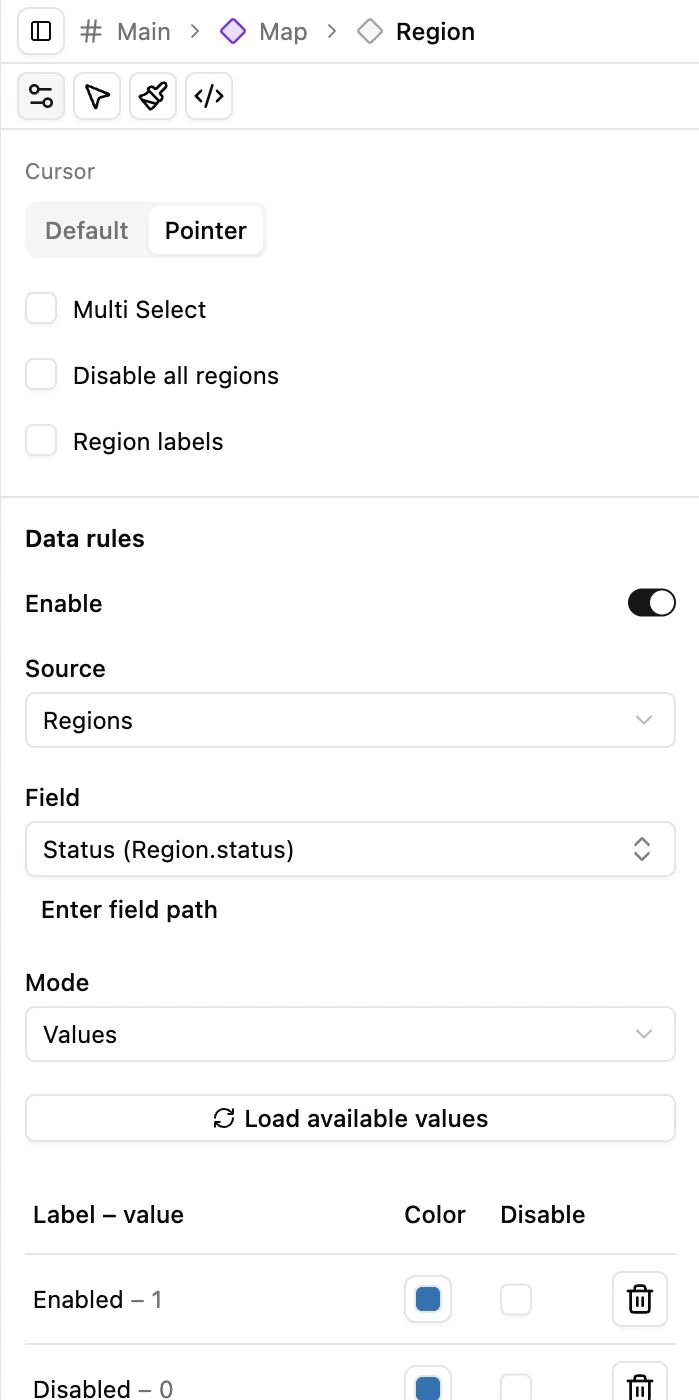
Select Region under Map to configure interaction state and data-driven appearance.
Base appearance
Section titled “Base appearance”Use Styles for Regions fill, Borders, and hover/selected colors or brightness. The documentation example uses #1274b7 with white borders.
A region that does not react may be disabled by Disable all regions, a matching Data rule, an exception, or its individual state. Hand mode also prevents pointer events from reaching the map. Check both the preview tool and the region’s configured state.
Set a field-driven rule
Section titled “Set a field-driven rule”- Open Region → Settings and enable Data rules.
- Choose Regions or linked Objects as the source.
- Select the controlling field. Nested fields can use the offered field picker or a supported custom field path.
- Choose Values, Ranges, or Gradient.
- Configure appearance and test records with known values.
Values rows use the selected field’s label/value choices. Edit those choices in the Collection’s Fields editor. Assign each value a color and decide whether its regions should be disabled.
Ranges use a lower-inclusive, upper-exclusive interval. For example, 0–100 includes 0 but not 100. Make boundaries unambiguous and avoid overlaps.
Gradient maps numeric values between low and high colors. Automatic limits for select/radio/status fields come from their options; other fields use available database values in the source scope. Zero is a value, not missing data. Set explicit min/max when comparisons must use a fixed scale.
Exceptions and priority
Section titled “Exceptions and priority”Review No data, Unmatched/out of range, Filtered out, No linked objects, and Multiple values. An exception can override color or interaction. Drag the priority rows to decide which matching result takes precedence.
When a Region has several linked Objects, choose whether to use a matching value or a special multiple-value appearance. Enable and title the legend if visitors need to interpret the colors.
Rules affect presentation, not stored values. Publishing a color rule does not update the underlying status field.