List
This tab contains all interactive SVG objects, which are called Regions in MapSVG.
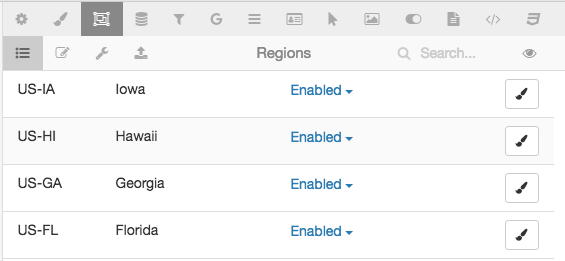
You can use text search in the top toolbar. Click the "Eye" icon to show/hide table columns.
Click the "Brush" icon on the right side of a Region row to change the color of a Region.
If you click a Region row, an editing form appears:
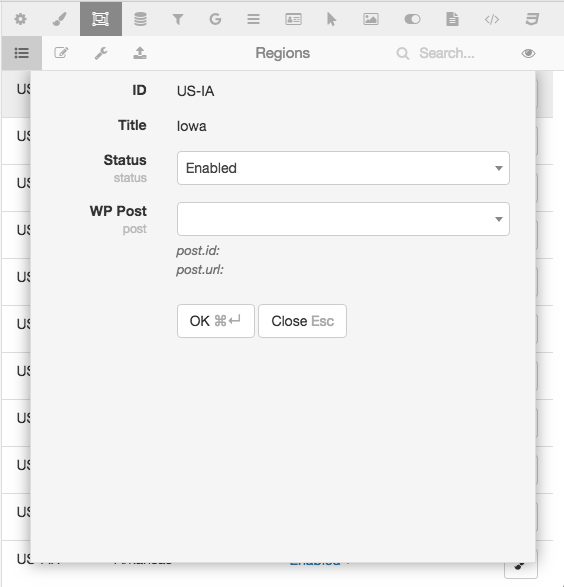
You can add custom fields to that form in the Regions > Edit fields tab.
You can also switch the map to "Edit regions" mode and click any Region on the map to edit it:
