Loading data from a custom API to a map in WordPress

We're thrilled to announce a long-awaited feature: custom API data source support!
We've been frequently asked if MapSVG can load data from custom API sources. This has been a challenging task because every API returns data in a different format, which needs to be converted to be compatible with MapSVG. But now, it’s finally possible!
Your maps can now display data from the following sources:
- WordPress posts
- MapSVG database
- CSV files
- APIs
You can find the full changelog here.
Tutorial: Add an API Data Source
Let’s walk through how to connect a map to a custom API data source. For this tutorial, we'll use mock API data from dummyjson.com.
Adding an API Data Source
Go to your map settings page, then to Toolbar > Database > Data Sources. Click the + button to add a new data source:
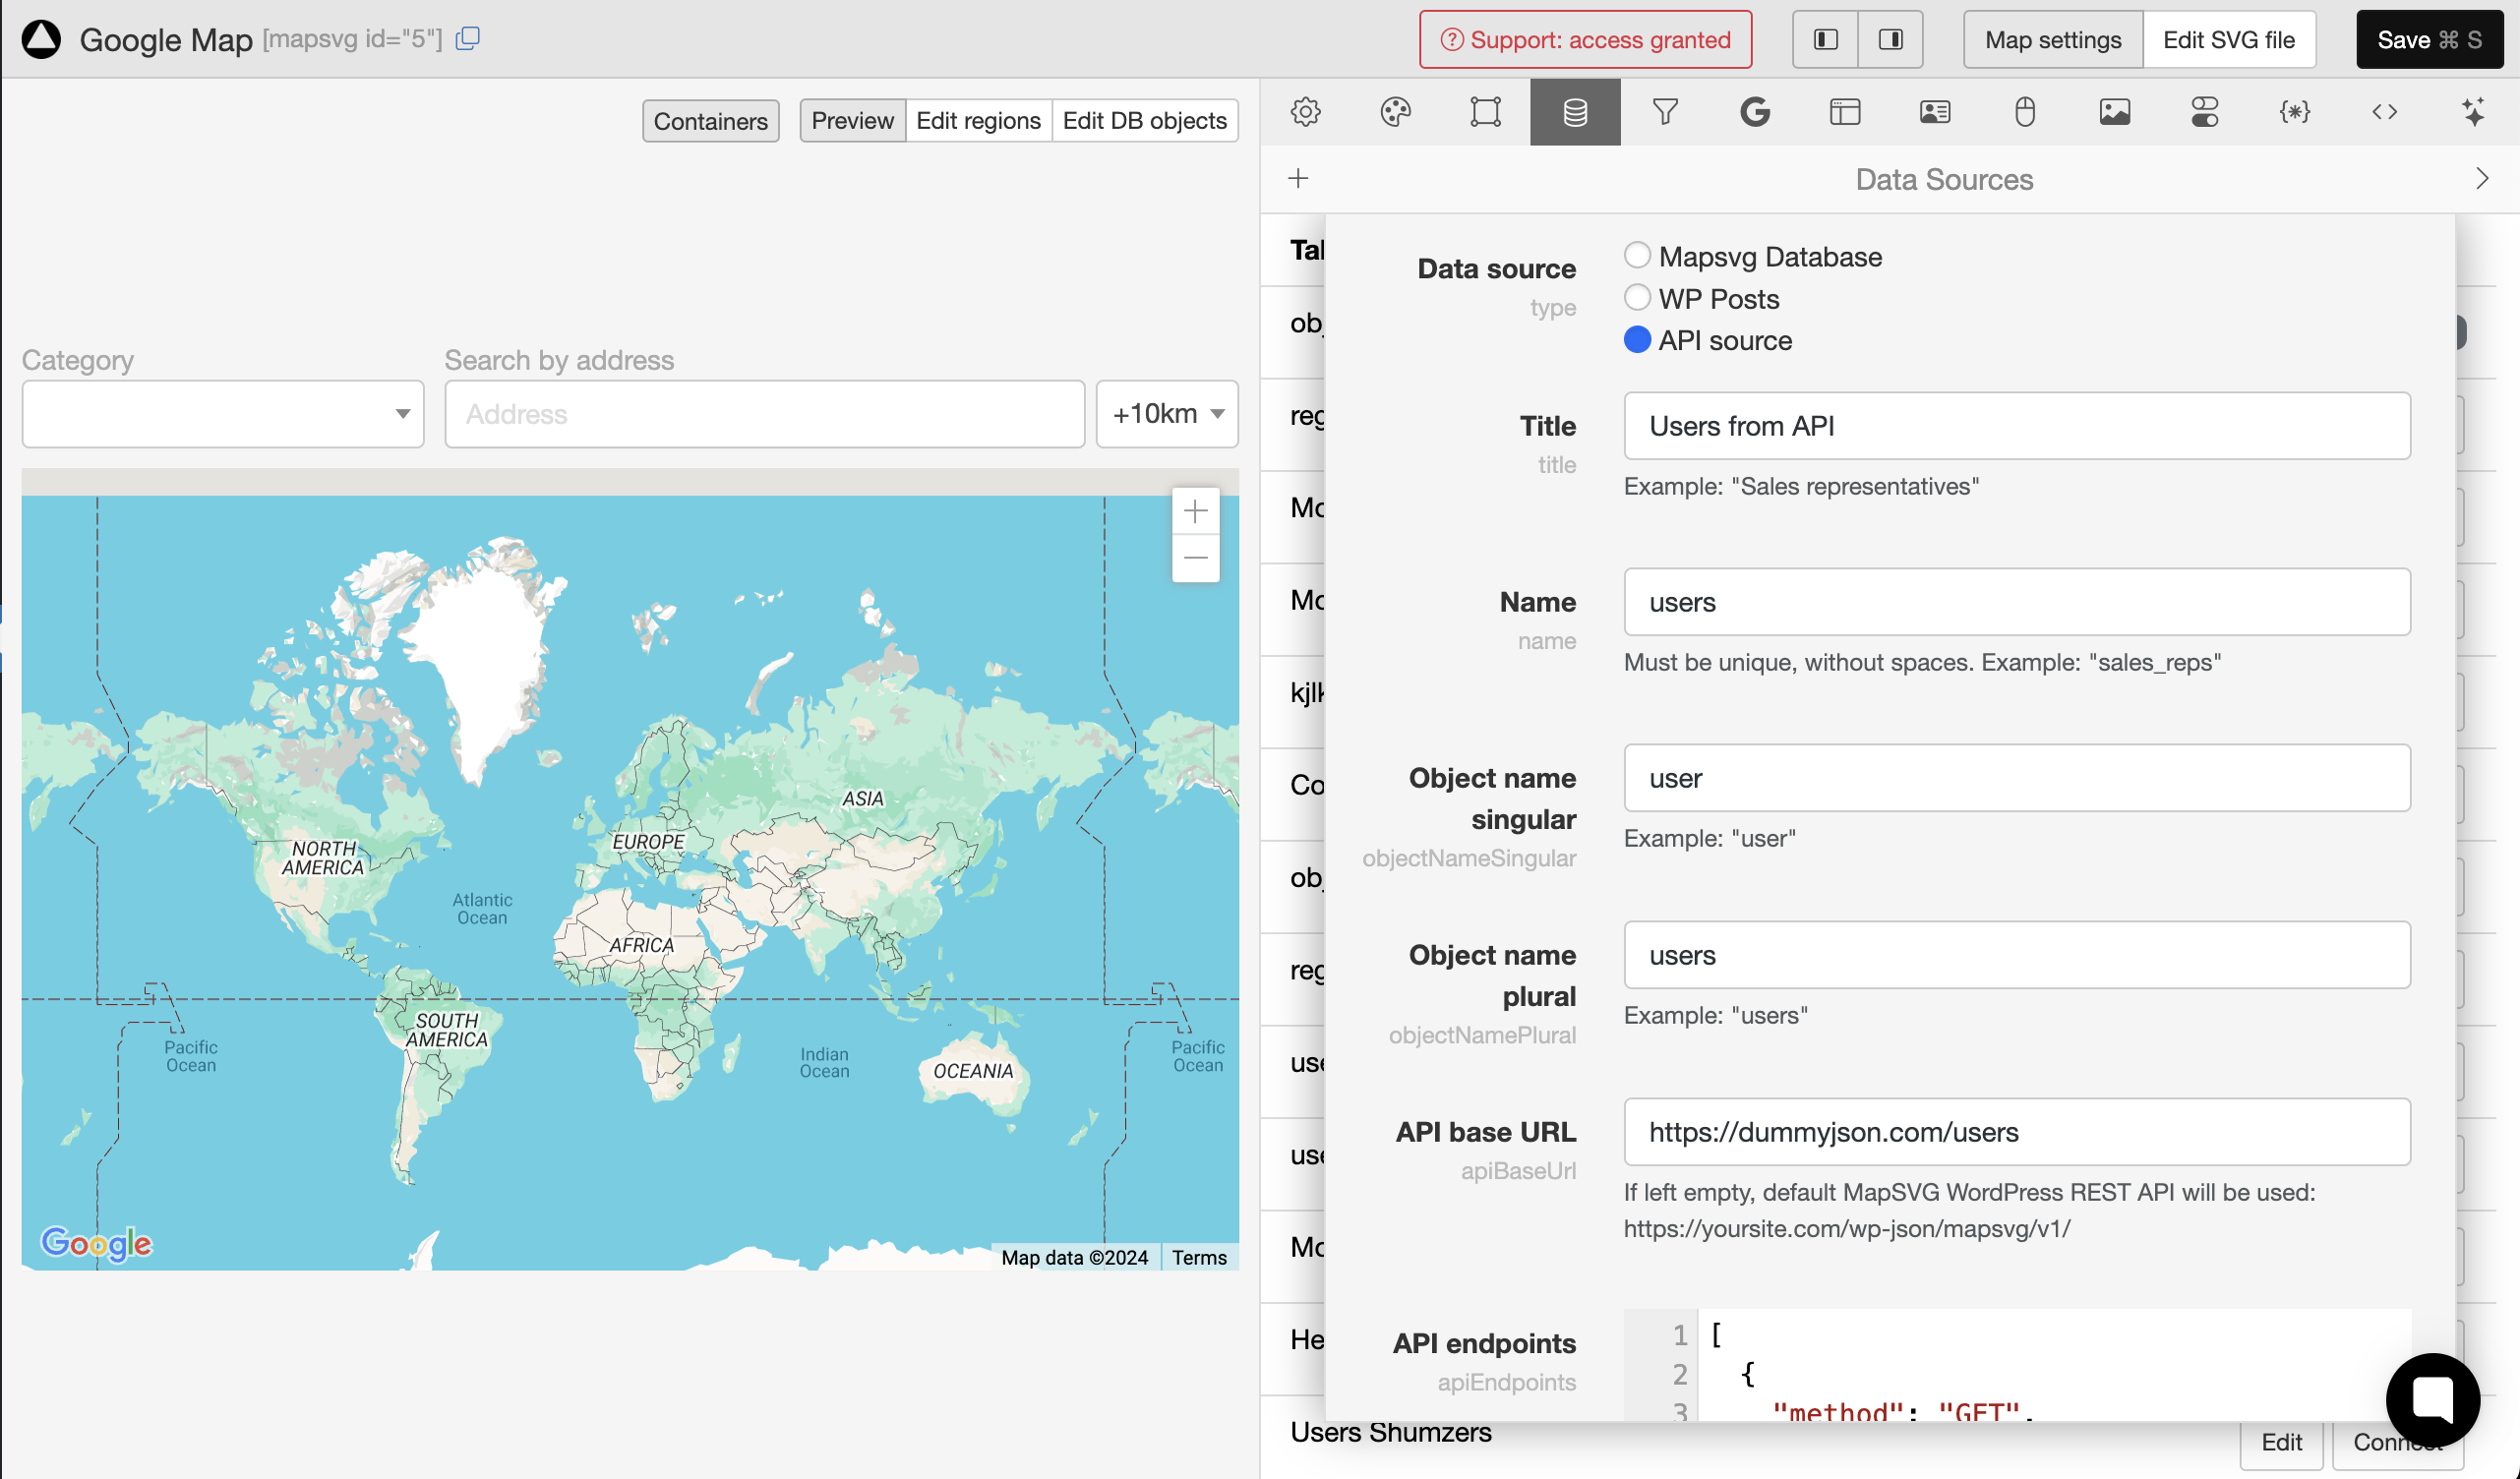
Choose "API" as the data source type. Enter the following information:
- Title: This will be the readable name for the data source.
- Name: Must be unique and without spaces. This name will be used to create a table in WordPress (if you choose MapSVG or WP Post data types).
- Object Name Singular: This name will be used to send or receive a single object from the data source. For example, if the name is "user":
{
  "user": {}
}
- Object Name Plural: This will be used to receive an array of objects from the data source:
{
  "users": {
    "items": [],
    "hasMore": false
  }
}
- API base URL: For this tutorial, we will use the API URL [https://dummyjson.com/users/]https://dummyjson.com/users/ but you can use your own;
- API endpoints in JSON format: If the API URL has placeholders that need to be replaced with object parameters, format them as [:paramName]. API endpoints should be an array in JSON format, containing objects with three parameters: name, method, and url. The name of the API endpoint must be one of these: index, show, create, update, delete, clear.
[
  {
    method: "GET",
    name: "index",
    url: "/",
  },
  {
    method: "GET",
    name: "show",
    url: "/[:id]",
  },
  {
    method: "POST",
    name: "create",
    url: "/",
  },
  {
    method: "PUT",
    name: "update",
    url: "/[:id]",
  },
  {
    method: "DELETE",
    name: "delete",
    url: "/[:id]",
  },
  {
    method: "DELETE",
    name: "clear",
    url: "/",
  },
];
Edit the Schema
At the moment, our data source in MapSVG contains only an id field. We need to add other fields that will come from the API.
We know that the data from the dummyjson.com API will be returned in the following format:
{
  "users": [
    {
      "id": 1,
      "firstName": "Emily",
      "lastName": "Johnson",
      "maidenName": "Smith",
      "age": 28,
      "gender": "female",
      "email": "emily.johnson@x.dummyjson.com",
      "phone": "+81 965-431-3024",
      "username": "emilys",
      "password": "emilyspass",
      "birthDate": "1996-5-30",
      "image": "...",
      "bloodGroup": "O-",
      "height": 193.24,
      "weight": 63.16,
      "eyeColor": "Green",
      "hair": {
        "color": "Brown",
        "type": "Curly"
      },
      "ip": "42.48.100.32",
      "address": {
        "address": "626 Main Street",
        "city": "Phoenix",
        "state": "Mississippi",
        "stateCode": "MS",
        "postalCode": "29112",
        "coordinates": {
          "lat": -77.16213,
          "lng": -92.084824
        },
        "country": "United States"
      },
      "macAddress": "47:fa:41:18:ec:eb",
      "university": "University of Wisconsin--Madison",
      "bank": {
        "cardExpire": "03/26",
        "cardNumber": "9289760655481815",
        "cardType": "Elo",
        "currency": "CNY",
        "iban": "YPUXISOBI7TTHPK2BR3HAIXL"
      },
      "company": {
        "department": "Engineering",
        "name": "Dooley, Kozey and Cronin",
        "title": "Sales Manager",
        "address": {
          "address": "263 Tenth Street",
          "city": "San Francisco",
          "state": "Wisconsin",
          "stateCode": "WI",
          "postalCode": "37657",
          "coordinates": {
            "lat": 71.814525,
            "lng": -161.150263
          },
          "country": "United States"
        }
      },
      "ein": "977-175",
      "ssn": "900-590-289",
      "userAgent": "Mozilla/5.0 (Macintosh; Intel Mac OS X 10_15_7) AppleWebKit/537.36 (KHTML, like Gecko) Chrome/96.0.4664.93 Safari/537.36",
      "crypto": {
        "coin": "Bitcoin",
        "wallet": "0xb9fc2fe63b2a6c003f1c324c3bfa53259162181a",
        "network": "Ethereum (ERC20)"
      },
      "role": "admin" // or "moderator", or "user"
    },
    {...},
    {...}
    // 30 items
  ],
  "total": 208,
  "skip": 0,
  "limit": 30
}
Let's add the user fields. Go to Toolbar / Database / Edit fields. For this tutorial, we'll add only the location, firstName, lastName fields, but you can add others as well. The field names must match the names in the API response:
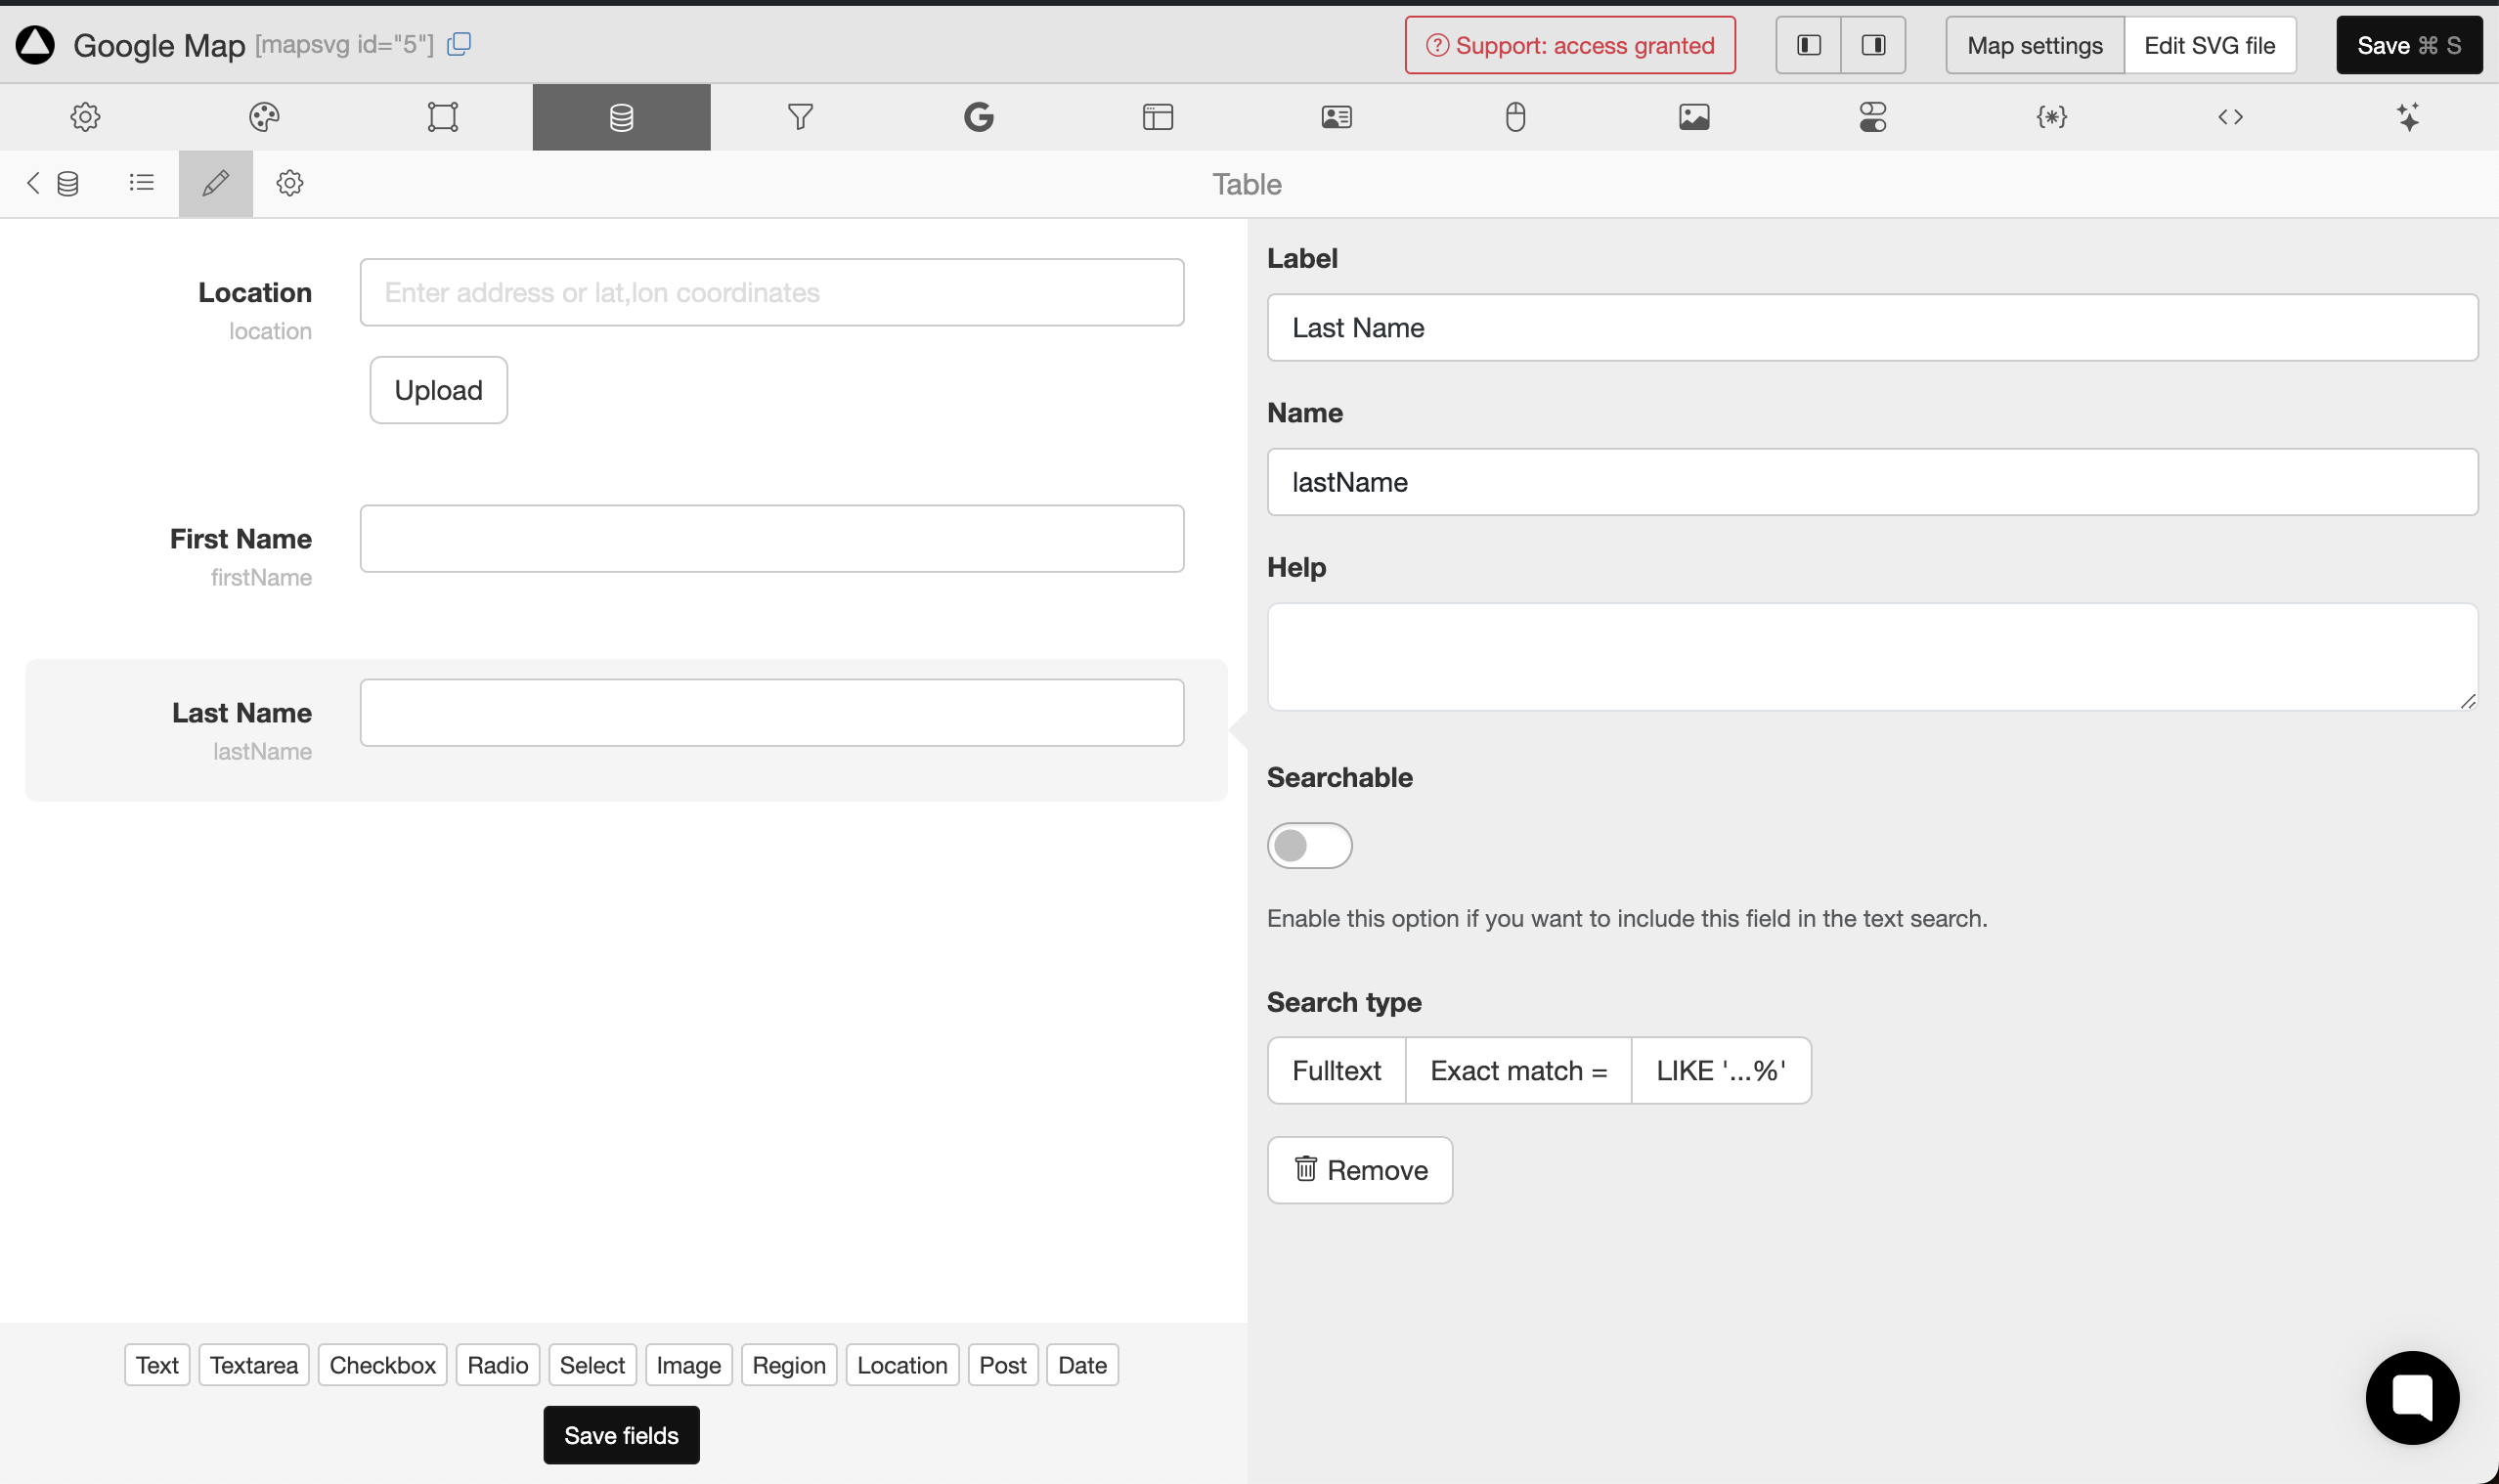
Click "Save fields" and go back to the list of objects.
Response middleware
Every API returns data with a different structure. We need to format the received data to make it compatible with MapSVG. The key parameter to format is location, which is used to add markers to the map. Also, MapSVG needs the hasMore parameter, which indicates if there are additional objects on the next page, to show or hide pagination buttons.
function(data, ctx){
  const { request, response, repository, map } = ctx

  if(repository.schema.objectNamePlural === "users" && request.action === "index") {

    const dataParsed = typeof data === "string" ? JSON.parse(data) : data;

    const dataFormatted = {
        items: dataParsed.users.map(user => {
          user.location = {
            address: {
              ...user.address,
              formatted: user.address.address
            },
            geoPoint: user.address.coordinates
          }
          return user
        }),
        hasMore: dataParsed.skip + dataParsed.limit < dataParsed.total
    };
    return dataFormatted;
  }

  return data;
}
Let’s break down what this code does, step-by-step.
function(data, ctx)
Every middleware has two parameters: data, which is the data passed for formatting, and ctx, which stands for "context".
const { request, response, repository, map } = ctx;
This structure is called "decomposition." We extract the request, response, repository, and map parameters from the context (ctx).
if(repository.schema.objectNamePlural === "users" && request.action === "index") {
The Response Middleware is called for every response from the data source, which could be a request to get maps, schemas, regions, or custom objects. We check which repository received the data by checking the value of repository.schema.objectNamePlural. We also check the request.action (which can be index, show, create, update, delete, or clear). We need to format the response when we receive an array of User objects, so the action is index.
const dataParsed = typeof data === "string" ? JSON.parse(data) : data;
Data can be received either as a string or as JSON. If it's a string we'll parse it using JSON.parse function.
And this is the most important part:
const dataFormatted = {
  items: dataParsed.users.map((user) => {
    user.location = {
      address: {
        ...user.address,
        formatted: user.address.address,
      },
      geoPoint: user.address.coordinates,
    };
    return user;
  }),
  hasMore: dataParsed.skip + dataParsed.limit < dataParsed.total,
};
Let's remember the structure of the "address" field in the user data returned from API:
{
"address": {
        "address": "626 Main Street",
        "city": "Phoenix",
        "state": "Mississippi",
        "stateCode": "MS",
        "postalCode": "29112",
        "coordinates": {
          "lat": -77.16213,
          "lng": -92.084824
        },
        "country": "United States"
      },
}
We need to take out the "coordinates" parameter and put it into the location field for mapsvg:
geoPoint: user.address.coordinates;
Also we need to gete the text address fields, and fill location.address.formatted parameter which must contain full address string.
address: {
          ...user.address,
          formatted: user.address.address
        },
Also, e need to provide the hasMore parameter to mapsvg, by summarizing skip,limit and comparing the result tototal paremeter from the API response:
{
  hasMore: dataParsed.skip + dataParsed.limit < dataParsed.total;
}
And finally, we return the formatted data from the middleare:
return dataFormatted;
That's it! Not let's get to formatting the reqest.
Request middleware
In addition to formatting the received data, we also need to adjust the outgoing requests sent to the API to handle pagination and filters properly. When MapSVG requests data from the server, it only sends the page number parameter. While MapSVG’s server understands the pagination settings, the external API might not. Dummyjson.com API expects to receive skip and limit parameters instead.
function(data, ctx){
  const { request, repository, map } = ctx;

  const itemsPerPage = map.options.database.pagination.perpage

  if(repository.schema.objectNamePlural === "users" && request.action === "index") {
    data = {
      ...data,
      skip: (data.page - 1) * itemsPerPage,
      limit: itemsPerPage
    };
  }

  return data;
}
Done!
See the data
Now let's check the map. Click the "Save" button and reload the page. Then open the "Database" tab:
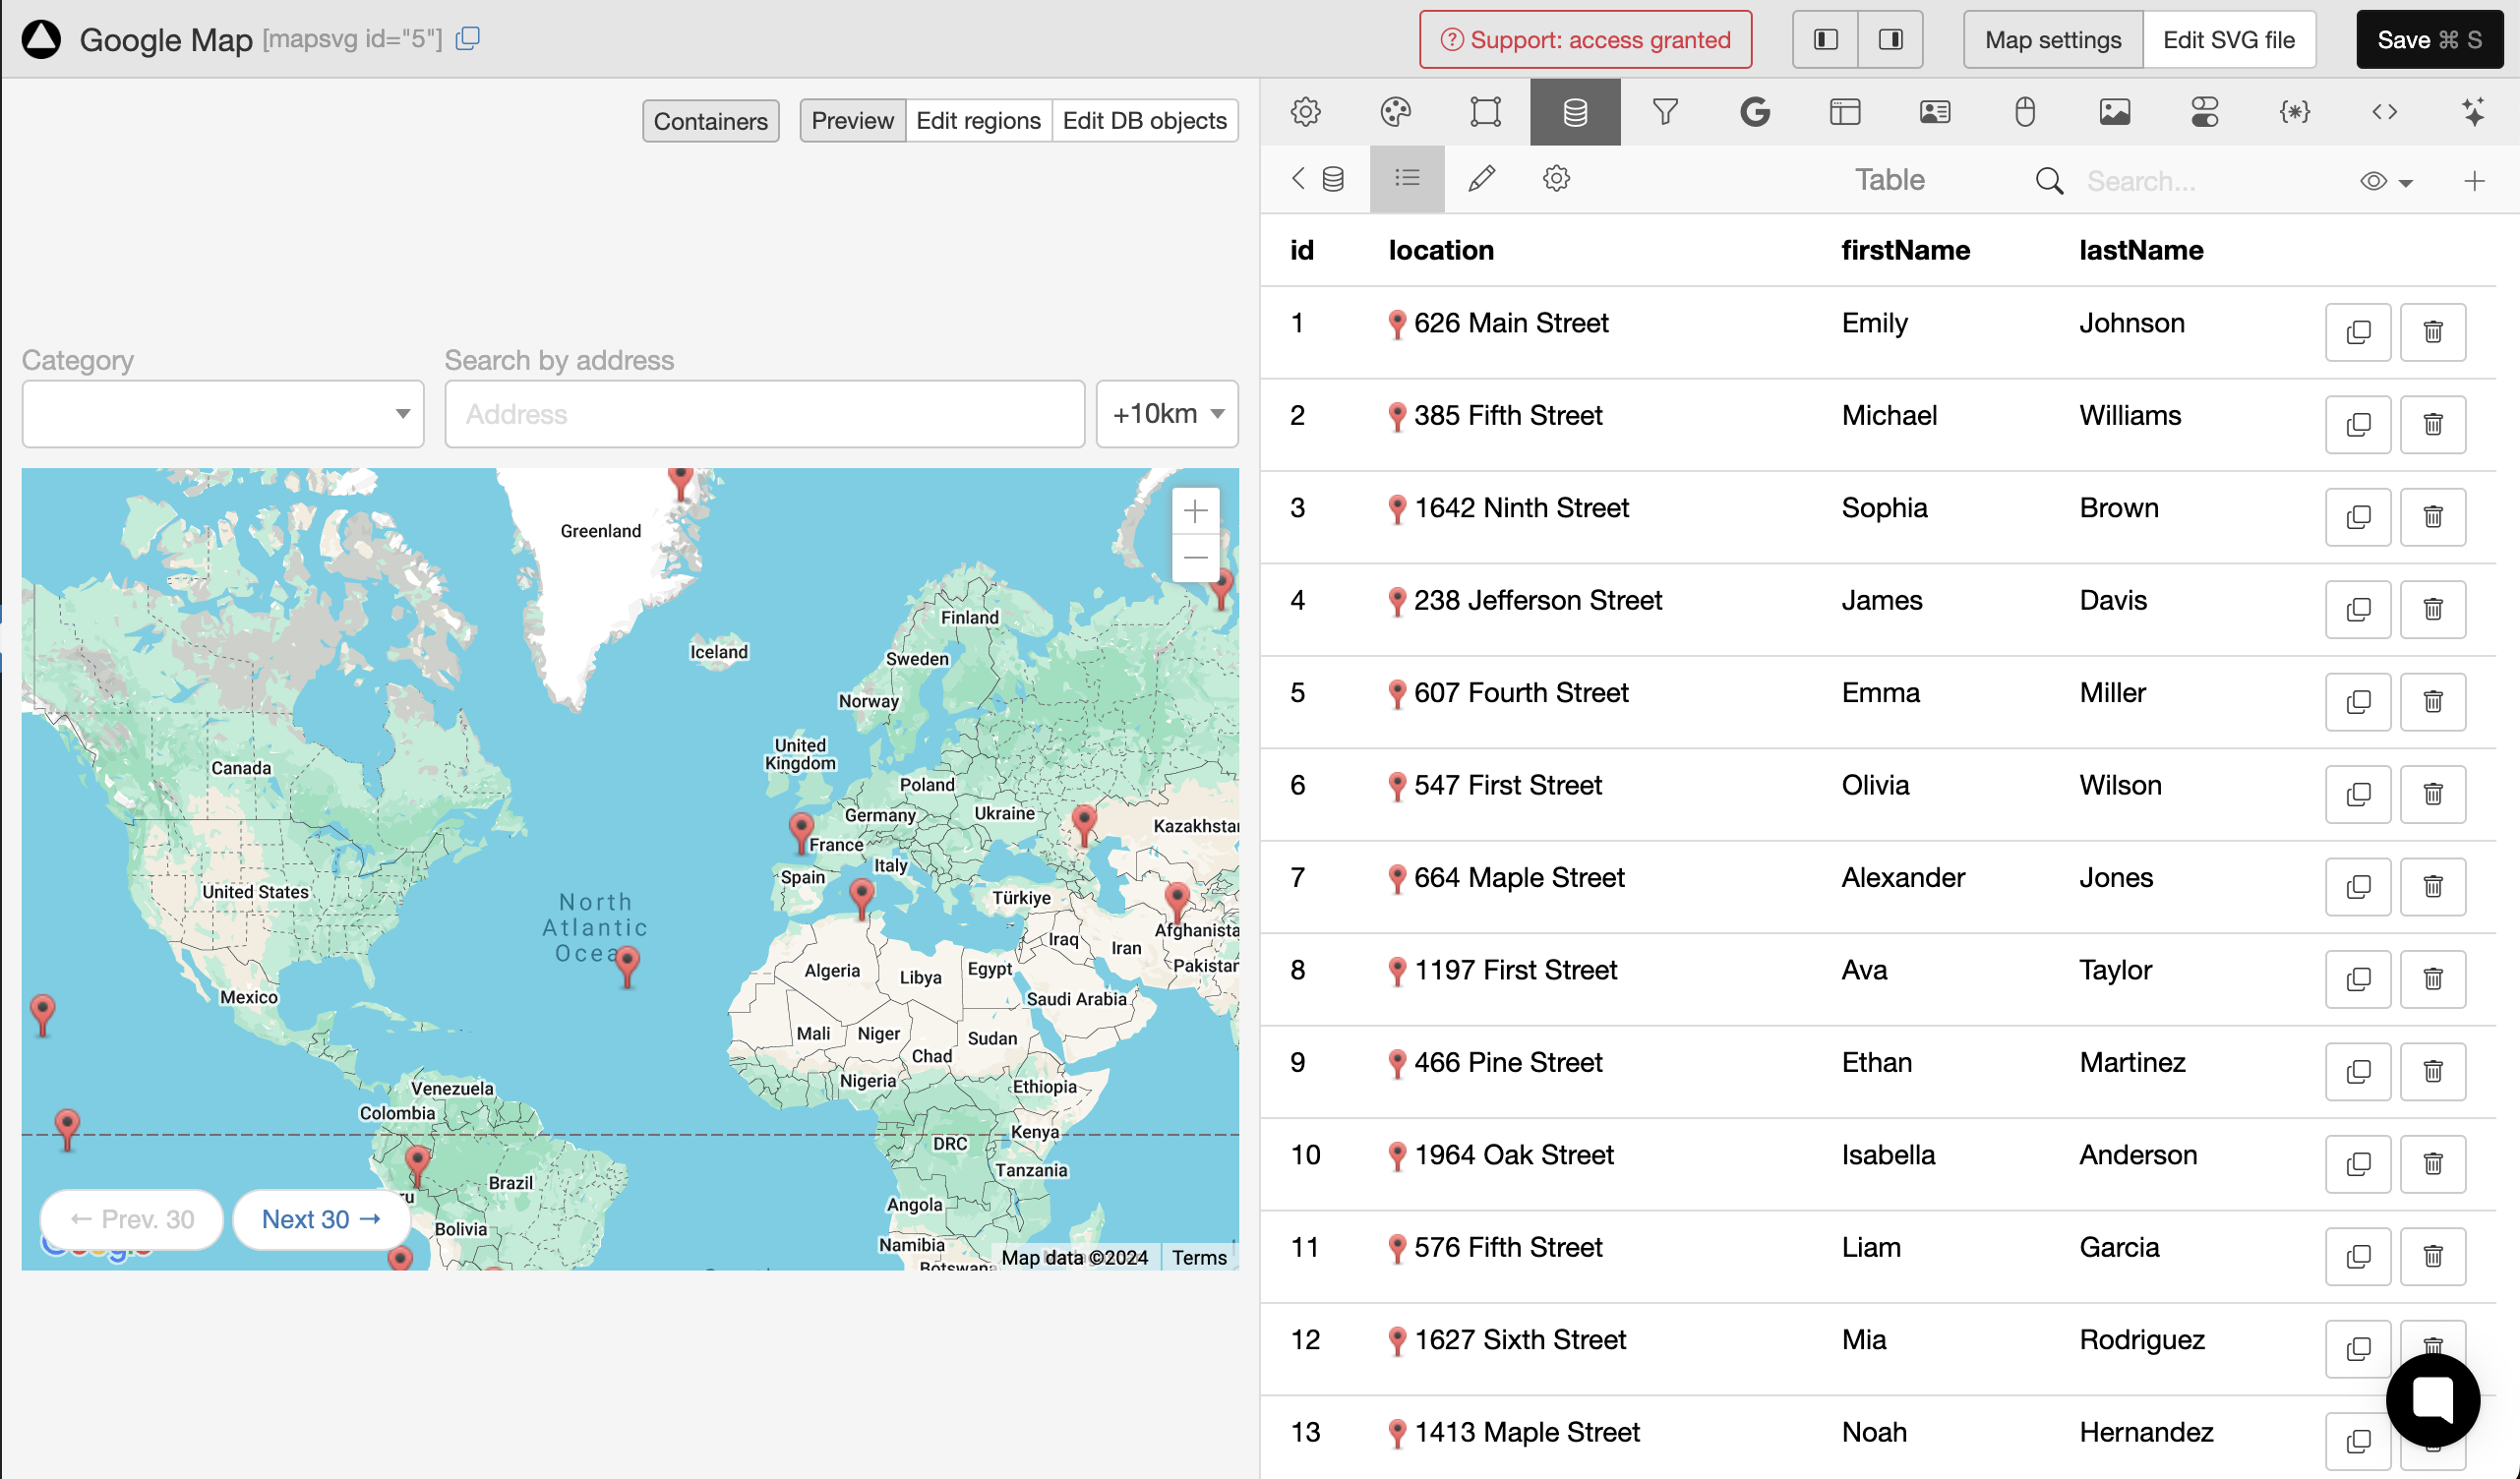
The map shows the locations and the "Database" tab shows the loaded users.
Check if pagination works: try to click the "Next 30" button. You should see next 30 markers loaded to the map.
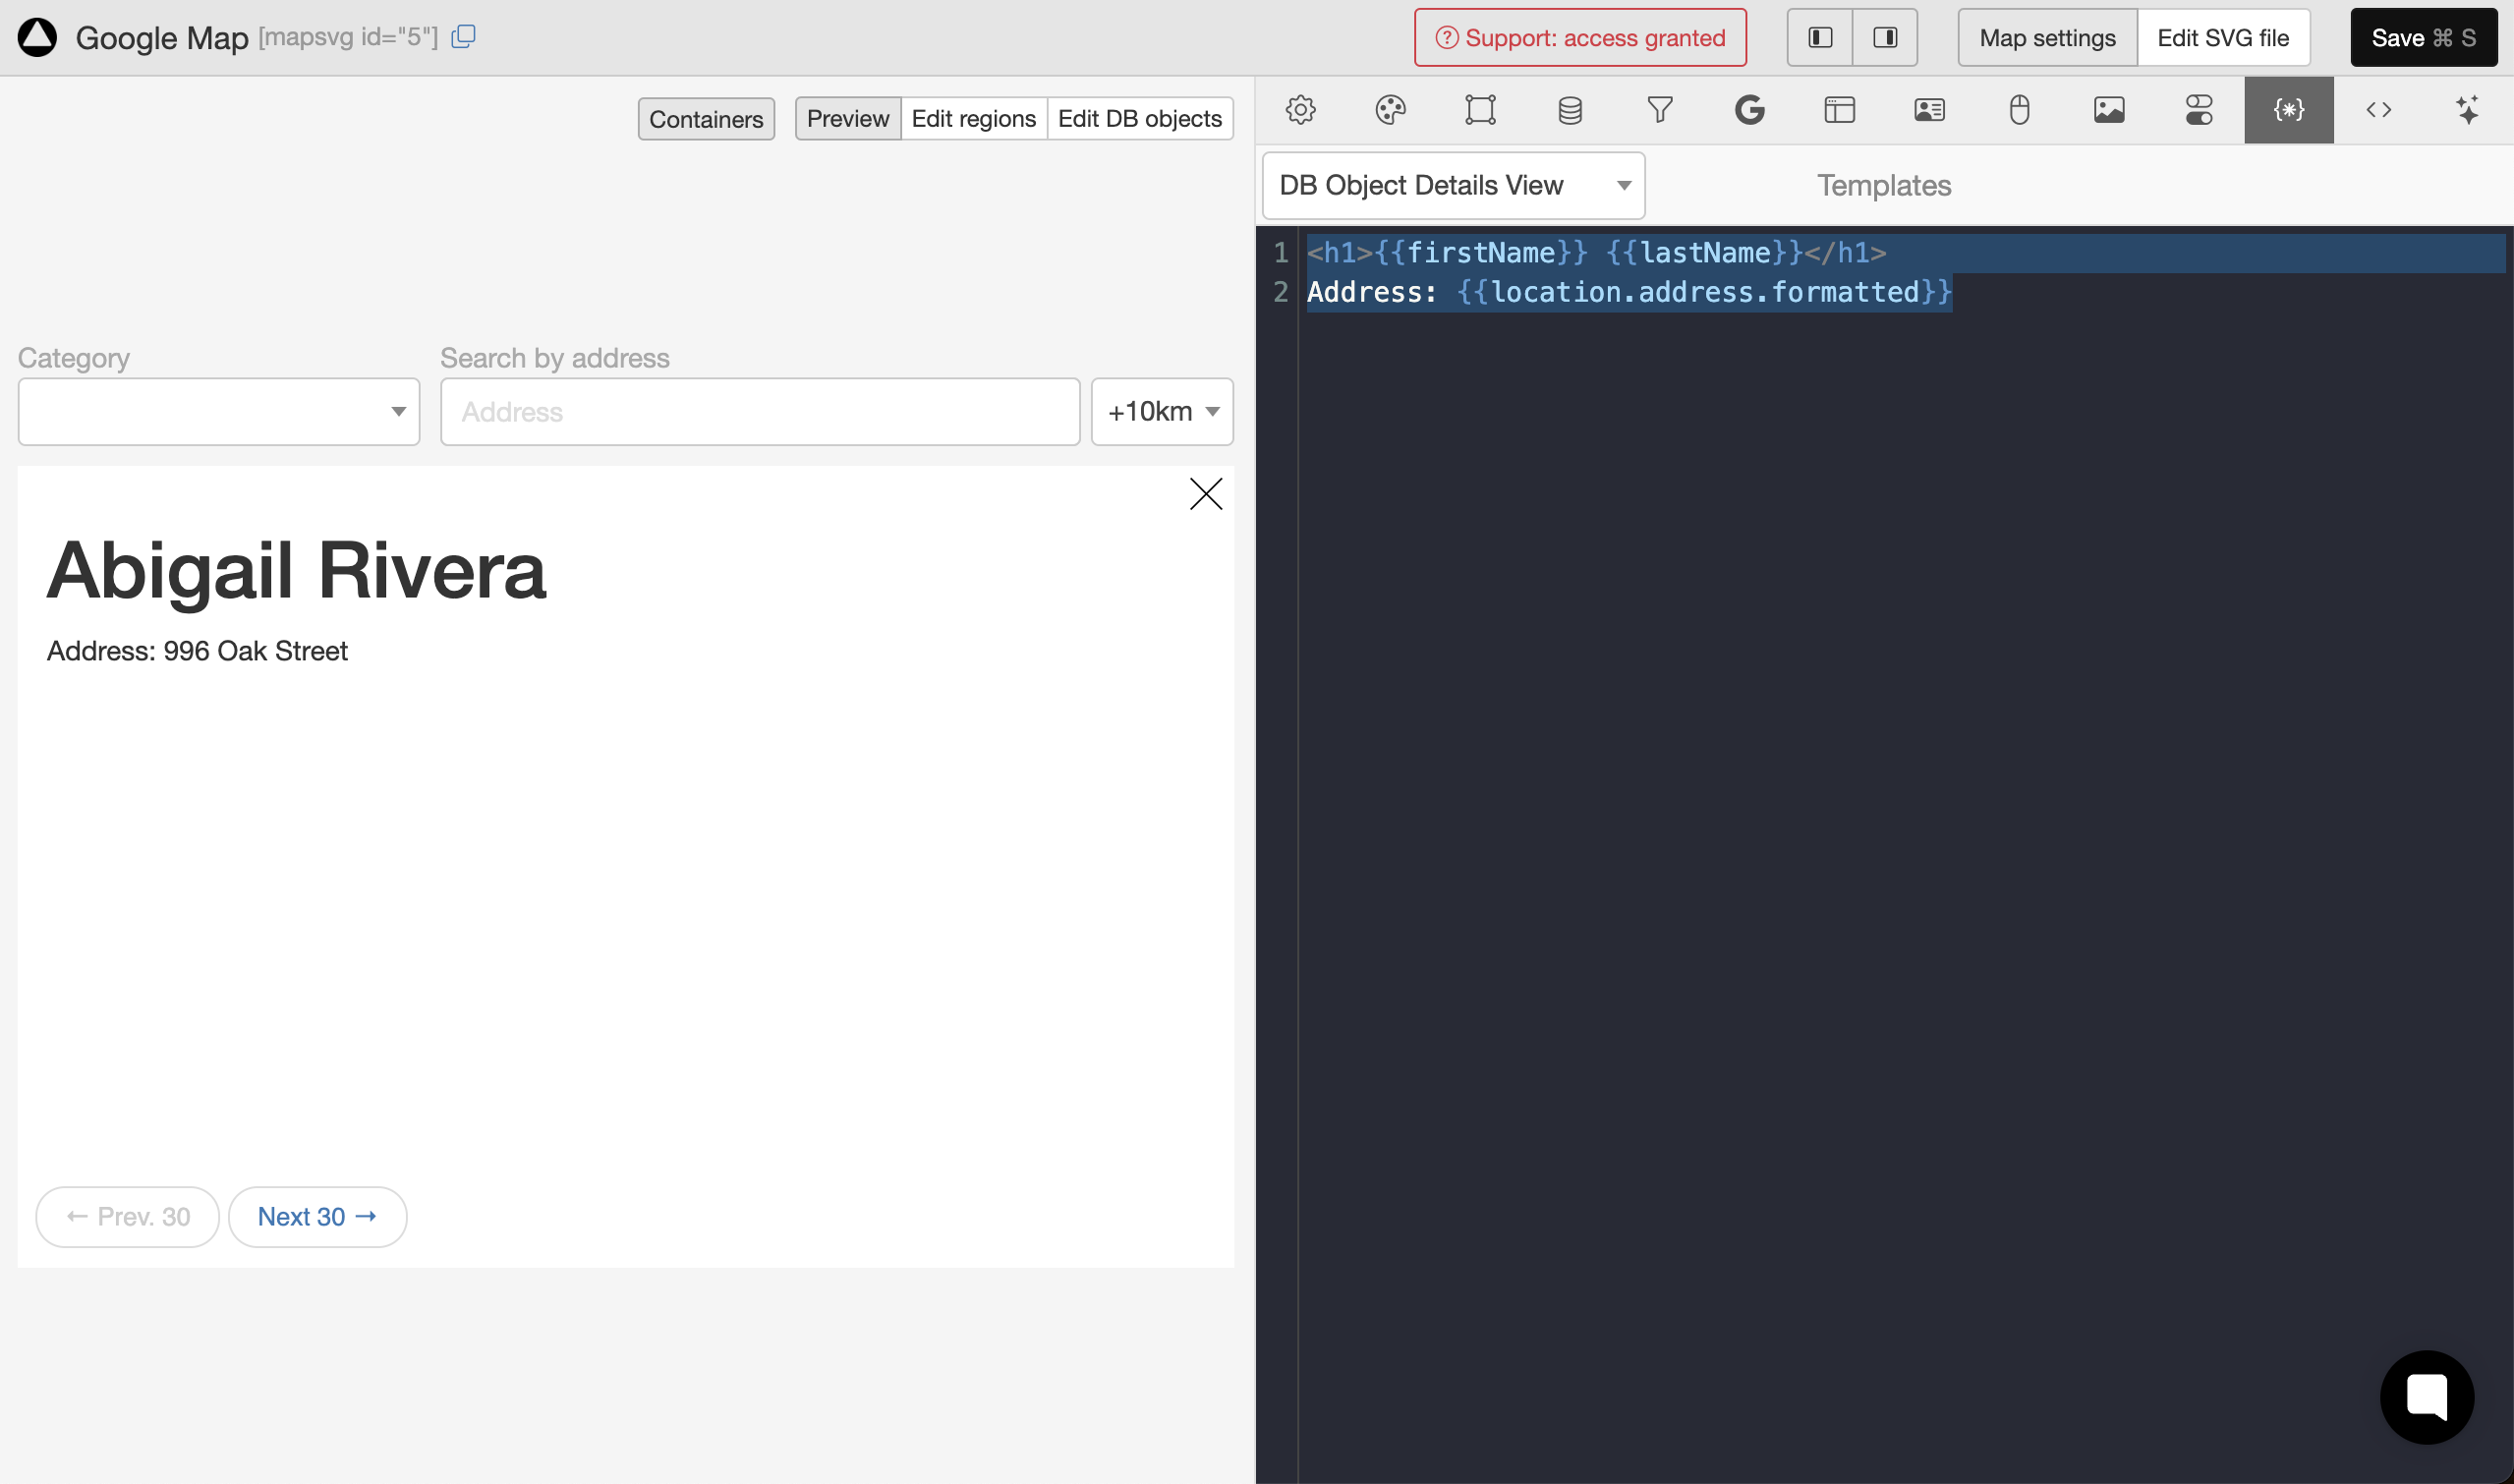
Edit the Details View template
Now let's show user details on click on a marker. Go to Toolbar / Templates / DB Object Details View and replace the template with the following content:
<h1>{{firstName}} {{lastName}}</h1>
Address: {{location.address.formatted}}
Click on any marker and see the result:
What's next?
If you want to go further, you can define create,update, delete API endpoints and extend the Request Middleware to handle those requests. If you do that, you will be able to create / update / delete objects in the "Database" tab!
Soon we'll also add support for filters with custom API sources.
Also, we're going to continue adding support for other data sources. At the moment, we're working on adding support for Google Sheets. If you have any other feature requests, don't hesitate to send them using the chat in the corner of the page!