MapSVG 2.x tutorial
Create a map from custom SVG file in WordPress
MapSVG is able to convert any SVG file into interactive image. You can use any vector editor for drawing which is able to save your work as SVG file. We'll use free open-source InkScape editor.
In this tutorial we'll cover a popular case - creating an interactive village plan
from JPEG image.
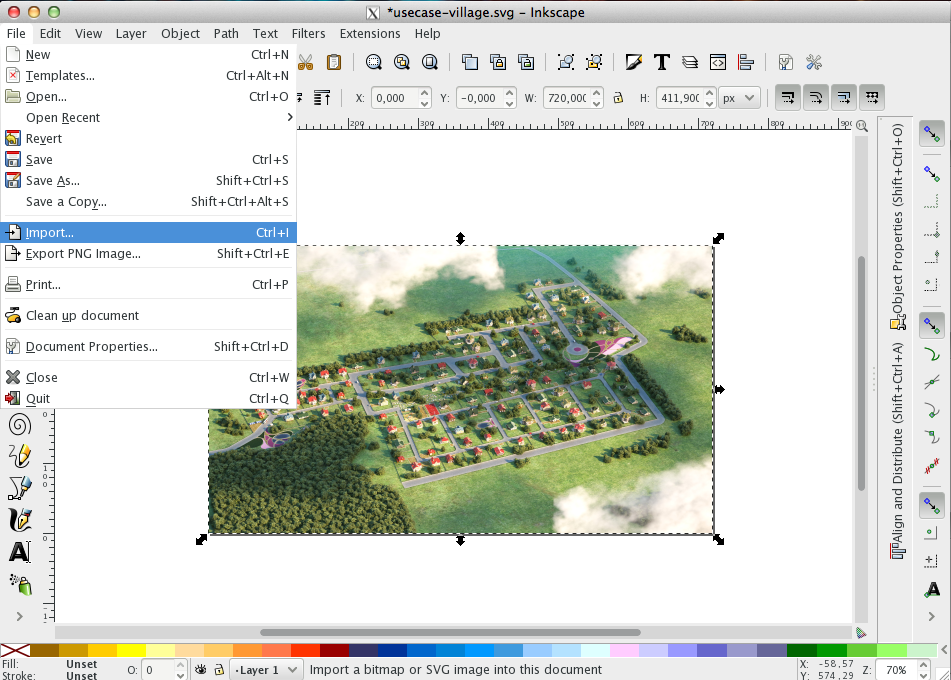
Create new file and import your JPEG background: File > Import > Choose > Embed.
Pay attention to Embed option, you want your image to be embedded into SVG file, not linked.
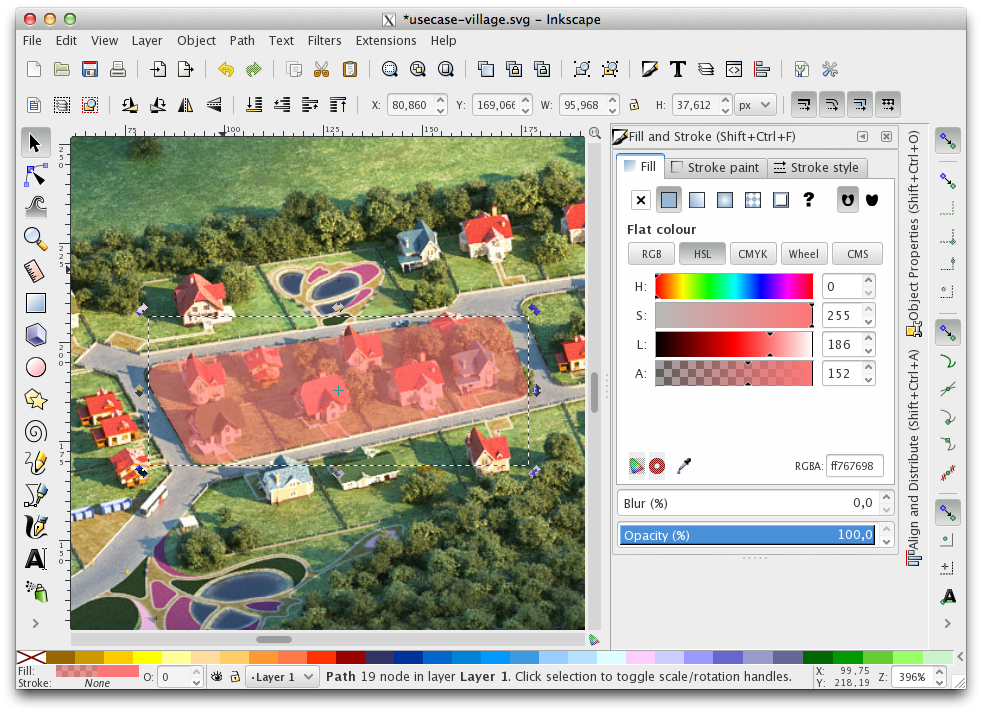
Zoom in to the image. Now we want to add transparent shapes on top of each land lot which would become semi-transparent on mouse hover/click.
We want all connected land lots to be perfectily connected without gaps so we need a special way to draw them:
we'll cut lots one-by-one from one big piece - like a pie.
Click on  and draw a path around first group of lots. Give it
a semi-transparent color and remove stroke around it.
and draw a path around first group of lots. Give it
a semi-transparent color and remove stroke around it.
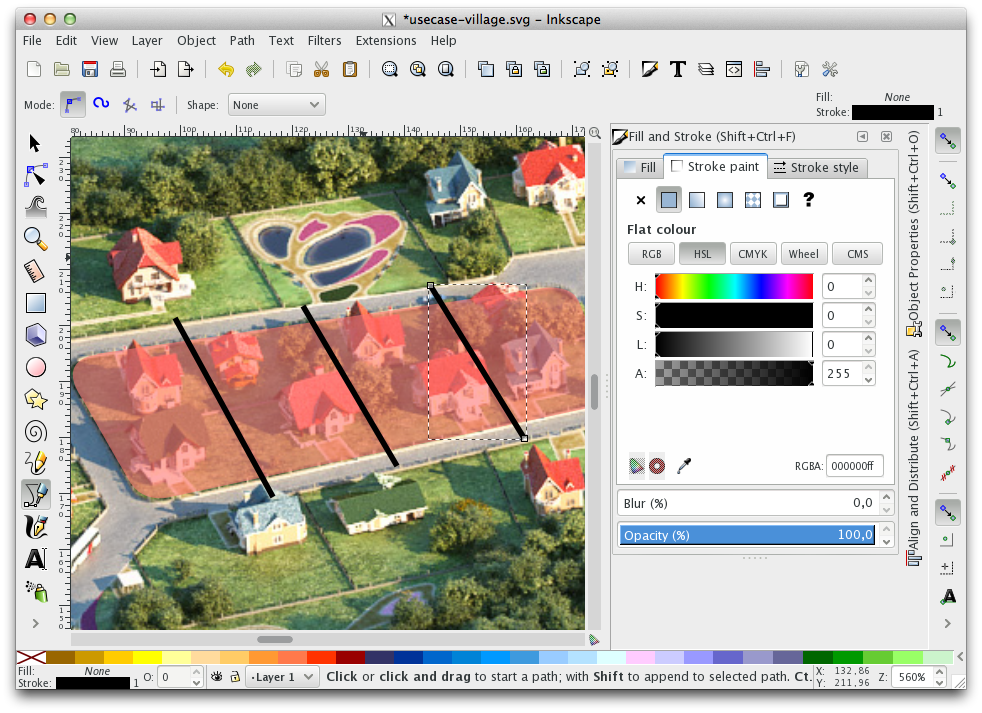
Using the same "pen" tool draw
short black lines on top of red shape. Lines should go slightly out of red shape's boundaries. These lines will be
your "cuts".
Select the last line and holding Shift key select the red shape to make them both selected.
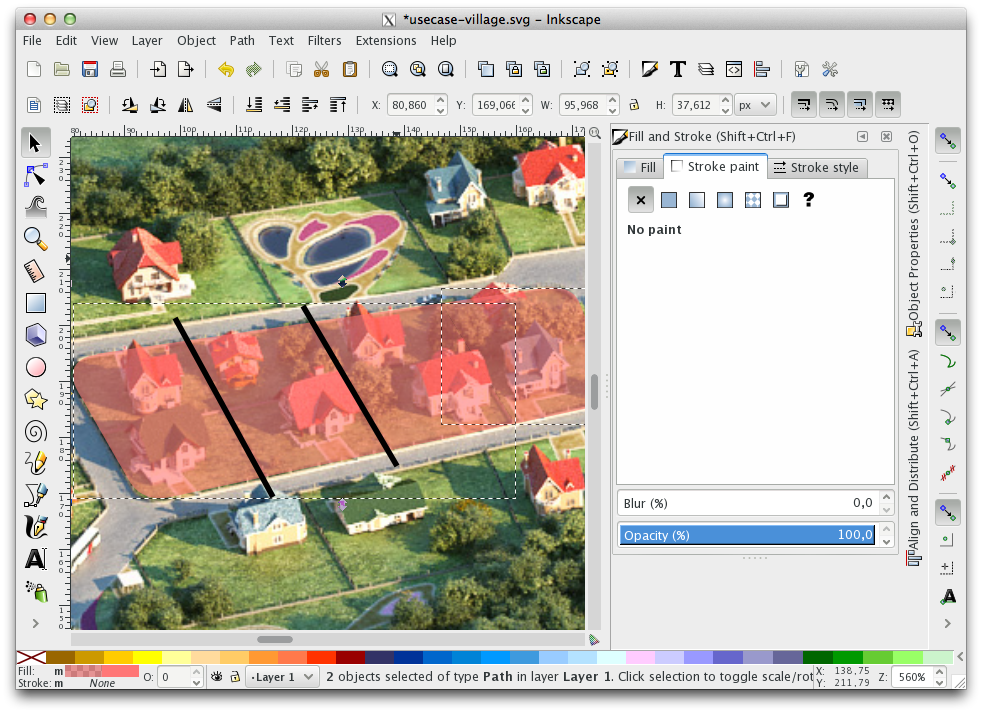
Go to Menu > Path > Division. Red shape will become cutten by the black line into 2 pieces.
Repeat this step with other lines and lots until you're done with the whole village plan.
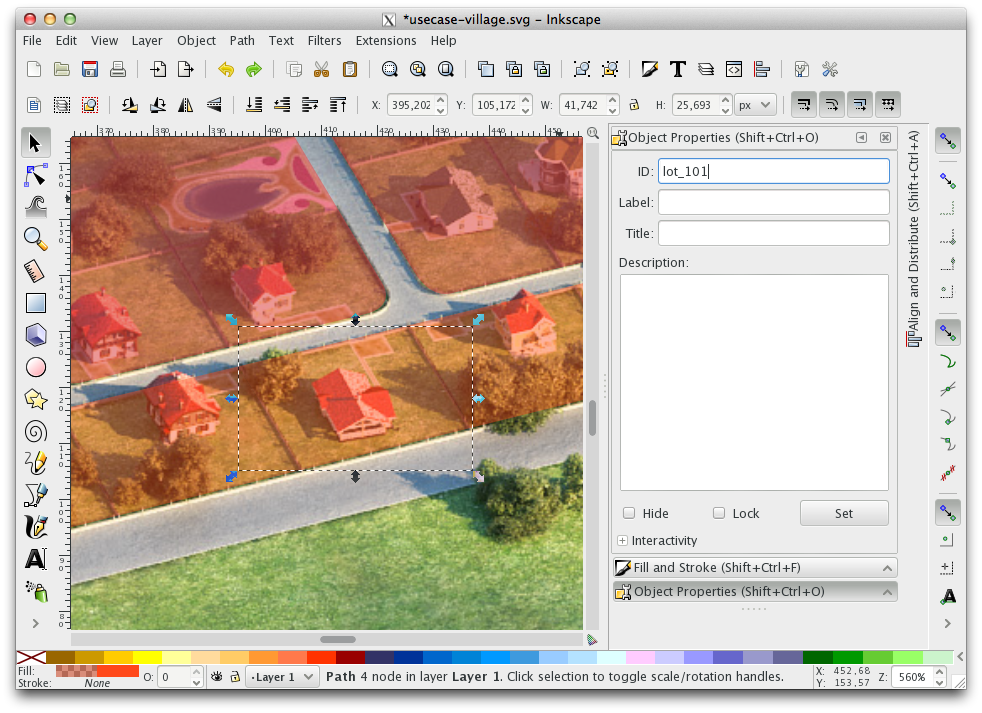
Don't forget to set ID for each lot so you would be able to find them later in MapSVG Builder.
Right-click on a lot, choose Object Properties, set ID, click Set button.
When you finish with IDs - save the file and you're ready to go to MapSVG. Don't worry about shape colors/transparency - you will change it later in MapSVG settings.
Upload your map to MapSVG by clicking on Browse button on start screen of MapSVG Builder.
Set Zoom and Scroll to On.
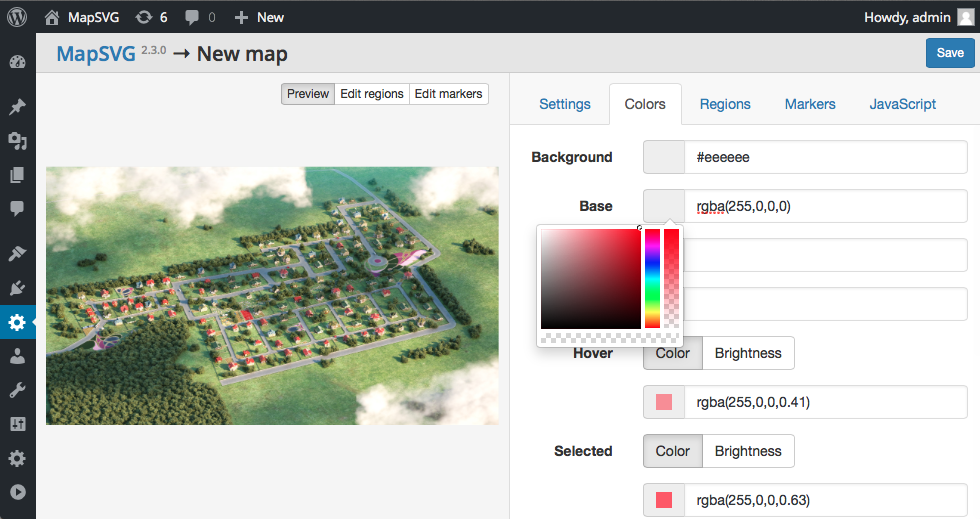
Now if we want to make lot shapes invisible until a user moves the mouse over them, let's go to
"Colors" tab. Set Base color to red and move the most right slider in color picker which
controls color opacity to bottom. You should get this color value in the input field: rgba(255,0,0,0).
First 3 numbers are amount of Red, Green, Blue - and the last number is color opacity.
Change Hover and Selected colors to Color mode. Copy-paste the color
from Base color input field and change color opacity to a higher value (0.5 for example).
Set all other settings like tooltips, popovers, etc. Click "Save" when you're done.
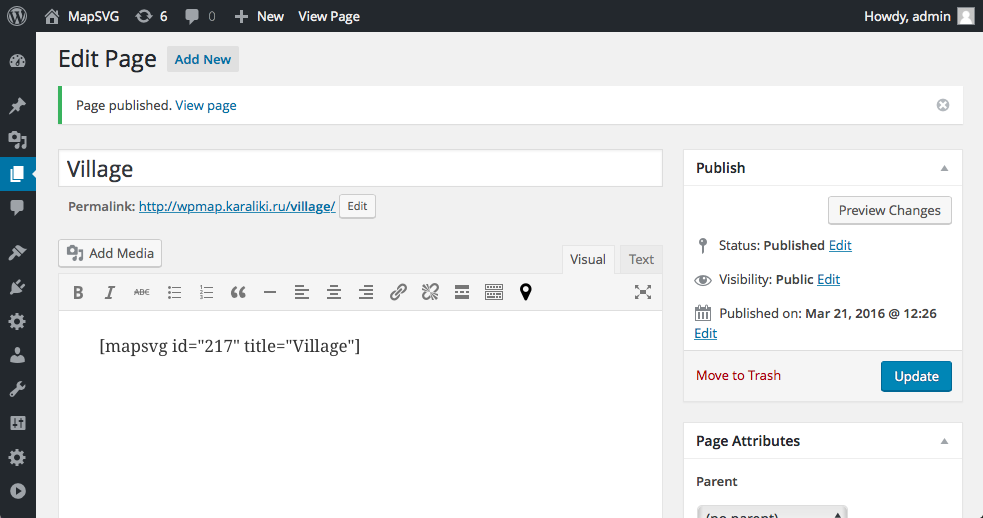
Go to WordPress Admin > Pages, add new page. Insert your map into the page by clicking on button in Visual Editor toolbar.
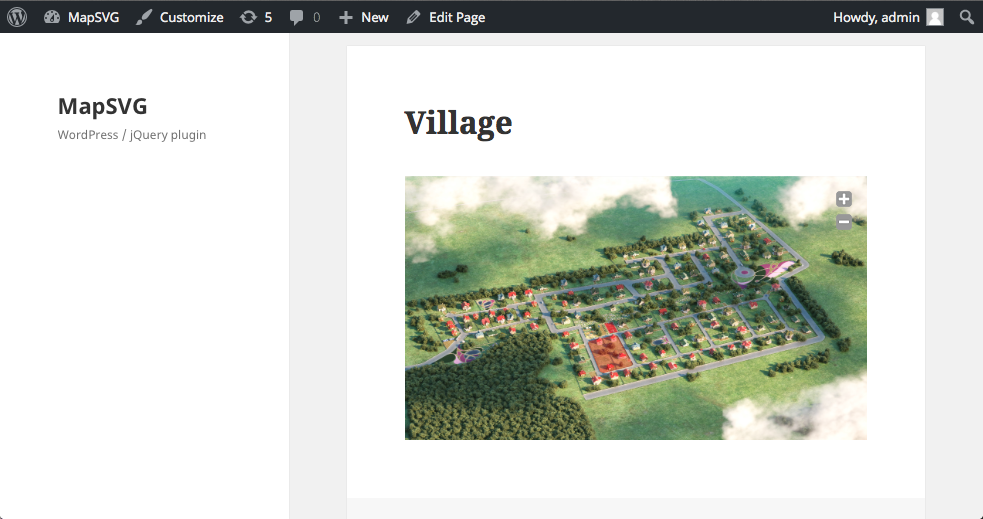
Save the page and see what we've got! Try to hover the mouse over properties to see how they are being highlighted. Awesome! Now you have an interactive village plan on your WordPress website!